


Understanding each part of the Assessment Dashboard is important for all business' that conduct an Assessment.
The navigation panel allows you to view control questions, view the Risk Assessments page, and view/create a report based on the Assessment you’ve just completed.
If you are wondering how much of the assessment you have left or unsure if you have answered all the control questions. Look no further than the % of assessment completed panel located on the right of the page.
This panel shows you what percentage of the questions you’ve answered and the percentage you have answered in each practice area.
To complete the assessment select Access Assessment.
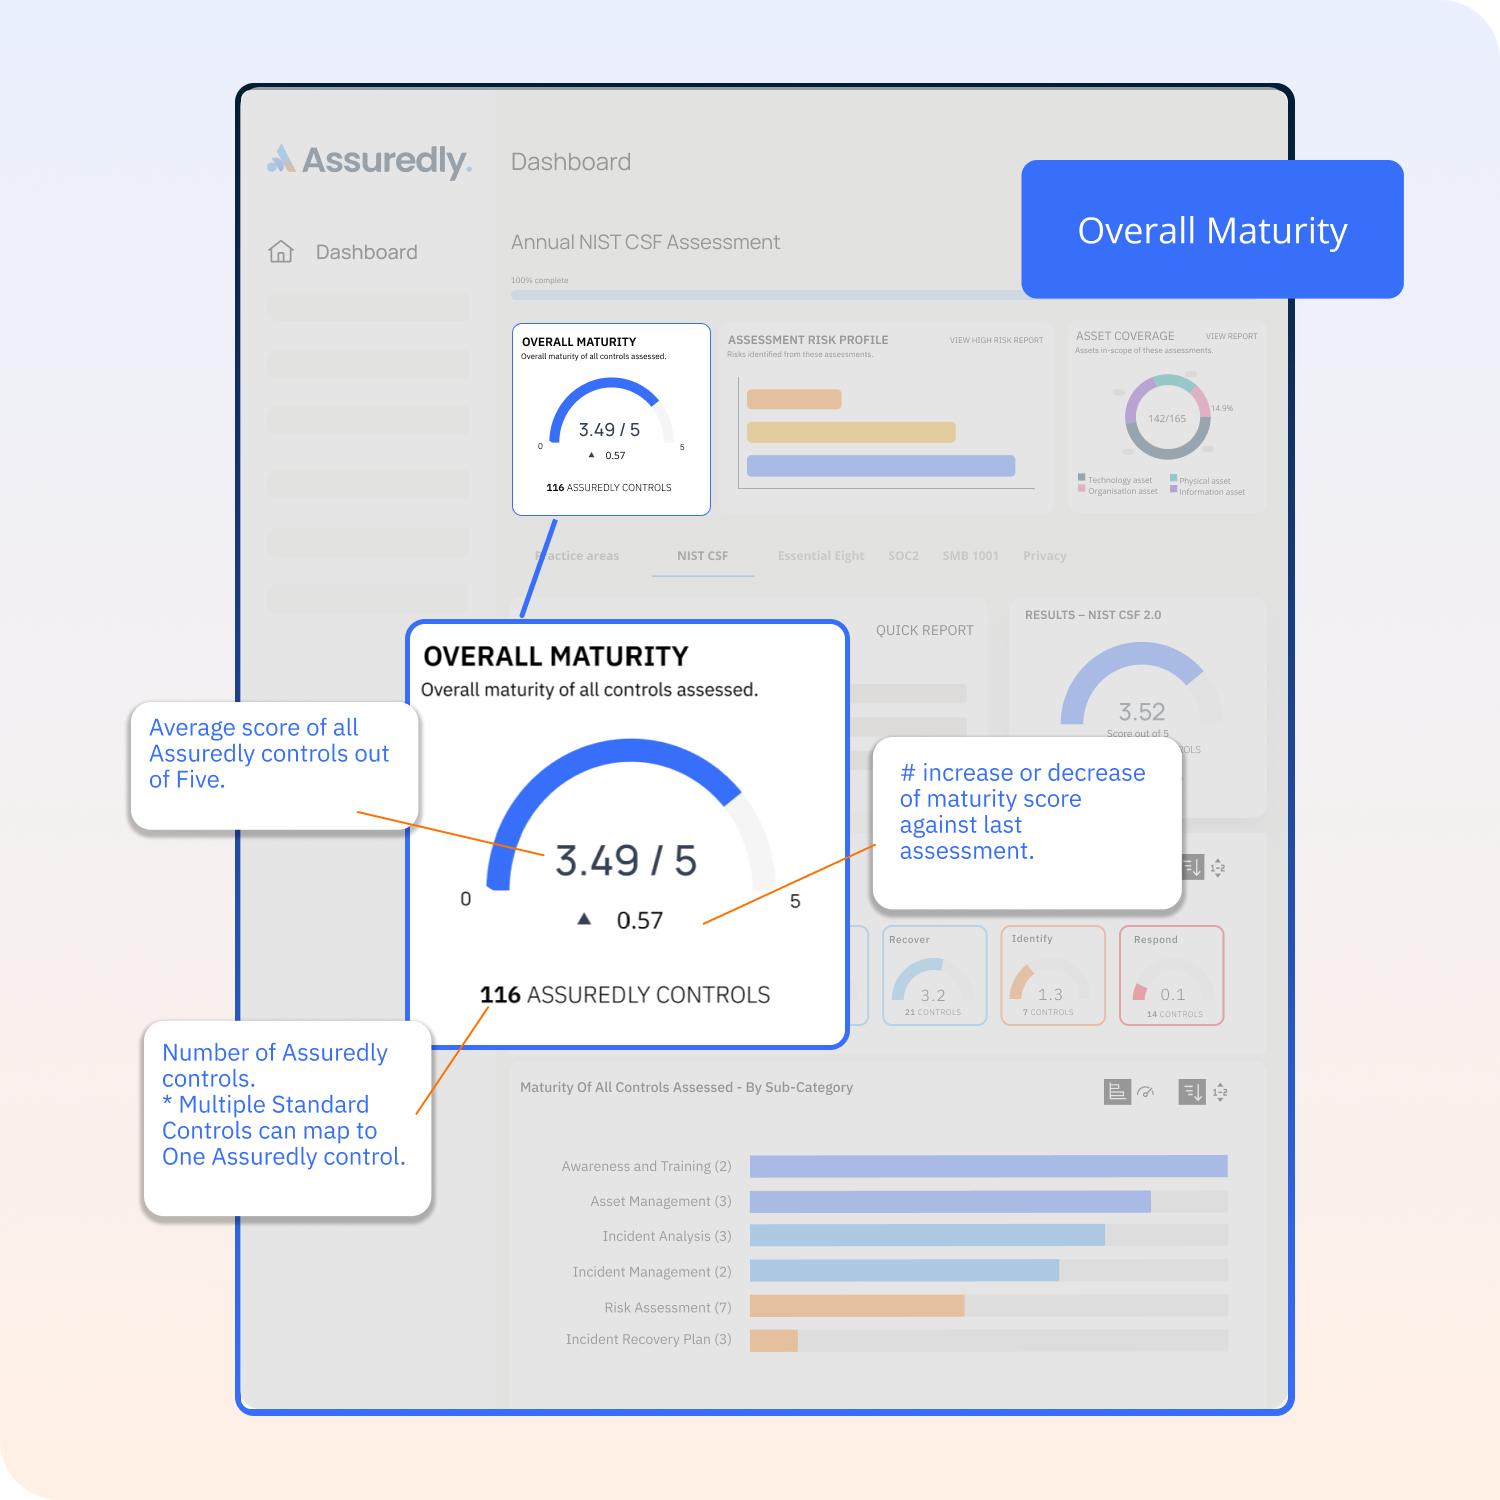
This graph tells you the overall maturity of all controls assessed regardless of which standards you have aligned the assessment too.
This graph provides a view of the risk profile based on the likelihood and impact of all the control questions you have answered.
Read more about how risks are assessed here.
This graph shows you what percentage of all assets from the asset register have been considered as part of this assessment and what type of assets they are.
How Practice Areas Display on the Dashboard
The overall maturity score for Assuredly controls assess the maturity of all Assuredly controls.
In some instances more than one standard control can be mapped to a single Assuredly control.

Select different standards to see how you measure up for each one!


